

QUARTERLY ENTRYPOINTS Q4 2025: UNDERSTANDING MIXED ECONOMIC SIGNALS
Market ups and downs are a regular part of investing, and 2025 has been no different. When markets drop—like during the sell-off caused by tariff concerns—it can feel uncomfortable. However, these drops can also provide chances to buy investments at better prices. On the flip side, when markets bounce back and reach new record highs, some investors may worry even when the basic business conditions remain solid. In either case, it becomes increasingly important to own a mix of investments that can handle all types of market conditions while keeping long-term financial goals in mind.
As we enter the last three months of the year, investors are seeing mixed signals. The S&P 500 index (which tracks 500 large U.S. companies) hit new record highs in the third quarter. Markets were lifted by solid company profits and excitement about artificial intelligence technology. At the same time, the job market has gotten noticeably weaker since early summer. This has raised worries about the overall economy and whether consumers are in good financial shape. Despite these concerns, the economy has been growing at a strong pace, and rising prices (inflation) have mostly stayed under control.
Market situations like this one show why having a long-term investment plan is so valuable. Instead of reacting to news headlines and economic reports, it’s better to build and hold a well-balanced portfolio that can handle market changes. This means understanding the major trends that will affect markets in the coming months.
IMPORTANT MARKET AND ECONOMIC EVENTS IN THE THIRD QUARTER
- The S&P 500, Nasdaq (which focuses on technology companies), and Dow Jones Industrial Average (which tracks 30 large companies) gained 7.8%, 11.2%, and 5.2% during the third quarter. All three reached new record highs in September. For the year so far, they have risen 13.7%, 17.3%, and 9.1%.
- International stocks from developed markets (MSCI EAFE) rose 4.2% and stocks from emerging markets (MSCI EM) increased 10.1% in the quarter.
- Gold prices rallied to a new record level of $3,841 per ounce, which represents a 16% gain during the quarter.
- Bitcoin ended at $114,641 for a gain in the quarter, although it remains below its August peak.
- The U.S. Dollar Index (which measures the dollar's strength against other currencies) fell to a low of 96.63 in September before ending at 97.78 for the quarter. For the year, the dollar has declined 9.9%.
- The Consumer Price Index (which measures inflation) increased 2.9% in August while core CPI (which excludes food and energy) rose 3.1%.
- Only 22,000 net new jobs were created in August according to the latest report by the Bureau of Labor Statistics (the government agency that tracks employment). Since May, the average monthly pace of job gains has been only 26,800.
- At its September meeting, the Federal Reserve (the central bank that sets interest rates) cut rates by 0.25% to a range of 4% to 4.25%.
STOCK PRICES RELATIVE TO COMPANY EARNINGS CONTINUE TO CLIMB TOWARD HISTORIC LEVELS
One of the most important things for long-term investors to consider is how expensive or inexpensive the overall market is. Rather than just looking at the price level of the market, we need to understand what we’re getting for that price in terms of company earnings, cash flow, sales, dividends, and other business fundamentals. When prices are high relative to these fundamentals, it suggests investors are optimistic. However, it can also mean that expectations may be too high in some areas of the market.
The chart here shows this using the Shiller price-to-earnings ratio for the S&P 500. This measures how expensive stocks are relative to company earnings. The current value of 38x is well above the 35-year average of 27x and is approaching levels last seen during the dot-com bubble in the late 1990s. This measure provides a longer-term view than standard price-to-earnings ratios because it uses ten years of earnings history, adjusted for inflation.
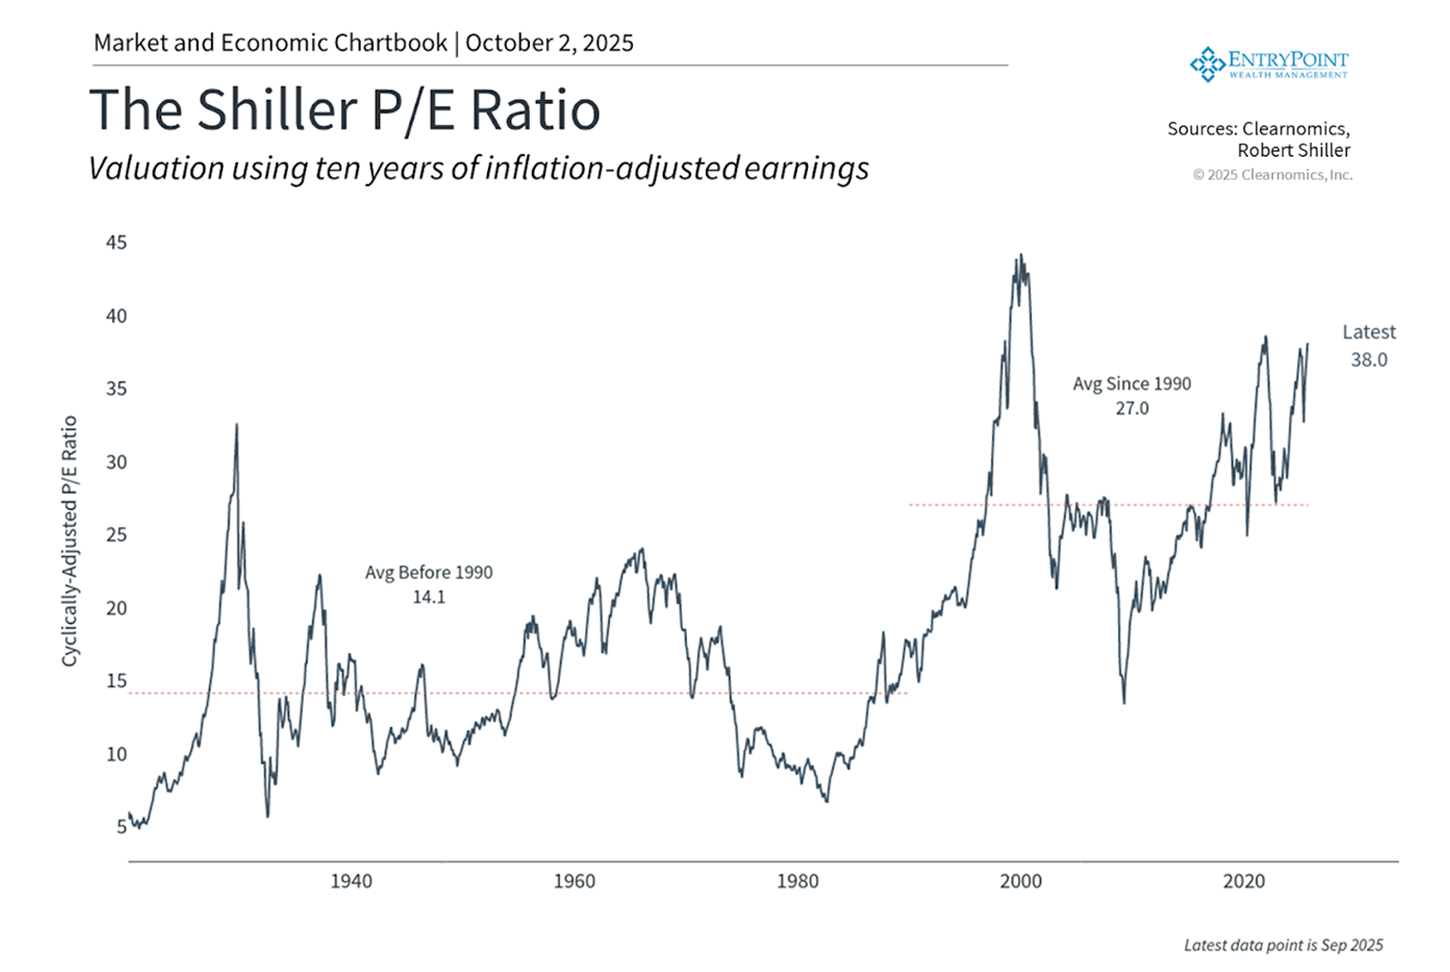
The Shiller P/E Ratio
Valuation using ten years of inflation-adjusted earnings.
Valuation using ten years of inflation-adjusted earnings.
It shouldn’t be surprising that prices are at these levels given the strong market rebound over the past two quarters. The S&P 500 has climbed 34% since April 8, resulting in a double-digit gain for the year. Technology stocks across various sectors have led the market both up and down. The Magnificent 7 stocks (a group of large technology companies), for instance, have risen 61% since the bottom. While investors are increasingly questioning whether corporate spending on artificial intelligence will generate positive returns, this has been a key driver of both the broader market and business investment.
It’s important to understand that these price measures don’t predict short-term market movements and shouldn’t be used for market timing. Instead, they serve as important inputs when deciding how to allocate money across different types of investments. While broad market prices are elevated, this isn’t the case across all parts of the market. For example, smaller companies, value stocks (companies trading at lower prices relative to fundamentals), and international stocks have more attractive prices than large companies, growth stocks (companies expected to grow quickly), and U.S. stocks right now. This can create opportunities for investors with a broader perspective and longer time horizons.
THE FEDERAL RESERVE IS LOWERING INTEREST RATES DUE TO WEAKNESS IN THE JOB MARKET
The Federal Reserve (the central bank) cut interest rates by 0.25% in September 2025, resuming its pattern of lowering rates after holding them steady through much of the year. This decision reflects the Fed’s attempt to balance stubborn inflation (rising prices) that remains above the 2% target with a weakening job market. This rate cut was widely expected and has served as positive support for markets in recent months.
There are many factors that make this rate-cutting cycle unique. Historically, the Fed has been forced to cut rates in response to economic crises or recessions. While there are some signs of weakness today, overall economic growth remains healthy. So, recent cuts represent something different: an attempt to normalize policy after the rapid rate increases that began in 2022. This is one reason the Fed is lowering rates even while the economy remains in expansion and markets trade at all-time highs.
The Shiller P/E Ratio
Valuation using ten years of inflation-adjusted earnings.
Valuation using ten years of inflation-adjusted earnings.
Perhaps the most important factor driving the Fed’s decision has been the deterioration in the job market. While the unemployment rate of 4.3% remains low by historical standards, the pace of job creation has slowed dramatically. August saw only 22,000 new jobs added, well below the average of 123,000 from earlier in the year.
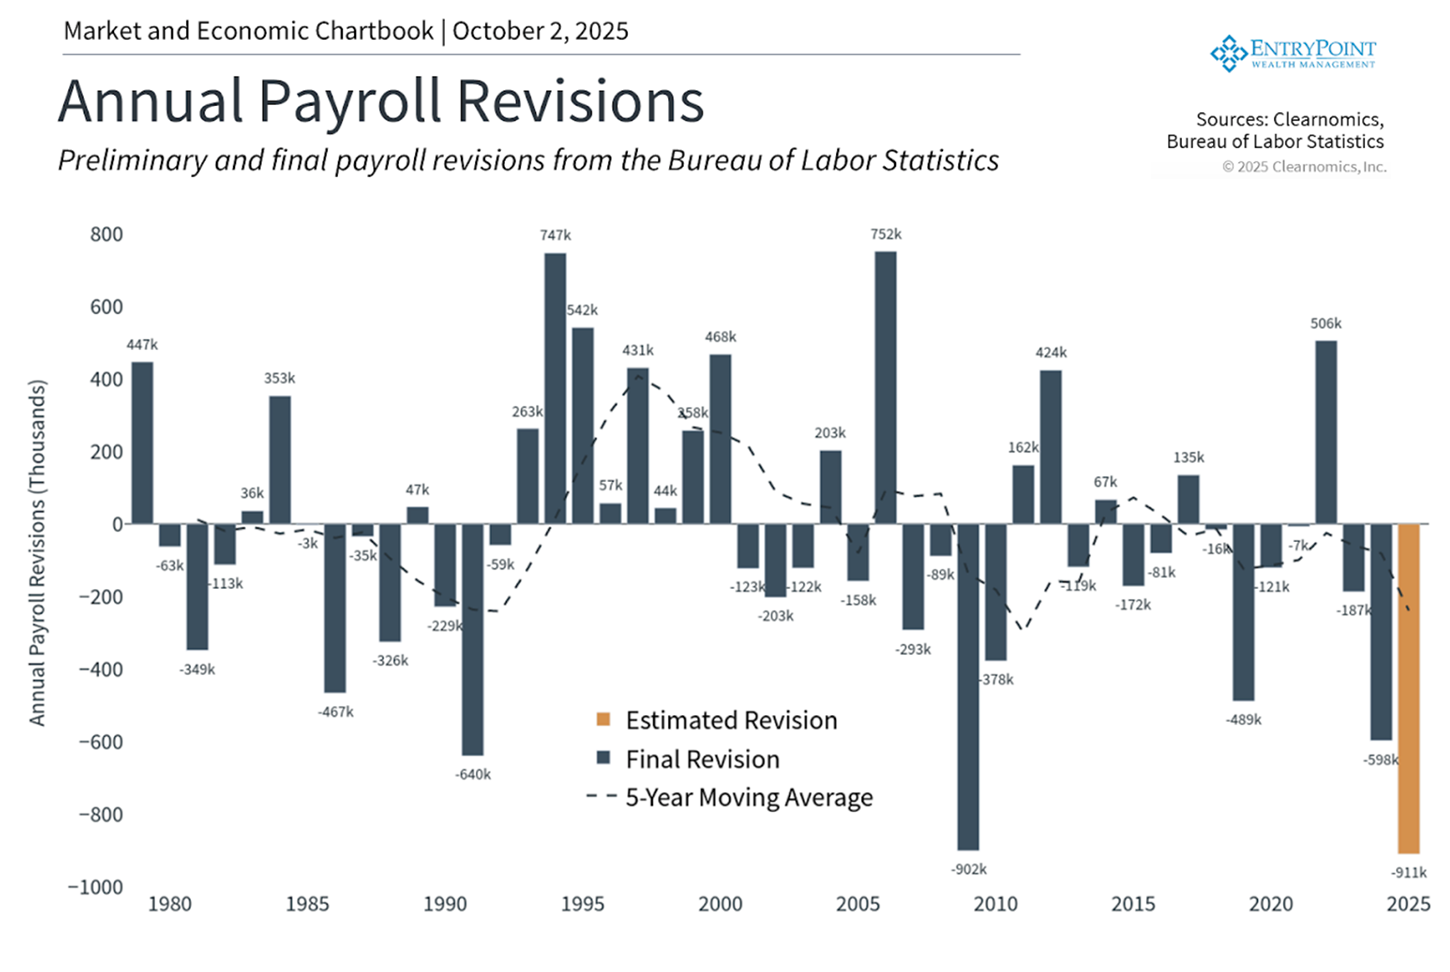
Even more striking are the revisions to employment numbers suggesting that 911,000 fewer jobs were created over the twelve months through March than originally reported, as shown in the chart above. The Bureau of Labor Statistics revises the employment numbers each year based on more accurate data than was available at the time of each monthly jobs report. While the numbers are still preliminary, a revision of this size would represent the largest in history, showing that the job market has been weaker than originally believed.
Therefore, the Fed is cutting rates because, according to the latest FOMC statement (the committee that decides on interest rates), it “judges that downside risks to employment have risen.” For investors, rate cuts typically provide support for both stocks and bonds if the economy remains strong.
MARKET SWINGS AND POLICY UNCERTAINTY HAVE EASED FOR NOW
After significant market swings driven by tariffs and tax concerns earlier this year, measures of economic policy uncertainty have improved. The VIX index (which measures expected stock market volatility) is hovering around 16.3, below the long-run average of 18. The MOVE index (which measures bond market volatility) has declined to 78, below the average of 87.
As many long-term investors know, periods of market calm can change quickly. The last several years have experienced many episodes of heightened volatility due to inflation, trade conflicts, Washington policy decisions, Federal Reserve actions, recession fears, international conflicts, and more. The current government shutdown is just the latest event that could shake markets in the short run, even if the long-run effects are limited. Similarly, the outcome of tariff policies and their impact on inflation remain uncertain.
For investors, this uncertainty may feel uncomfortable, but it’s also what drives long-term portfolio outcomes. The last several years also highlight the difference between what investors feared and how markets actually performed. Rather than viewing uncertainty as something to avoid, successful long-term investors recognize it as a normal feature of markets that creates the opportunity to position portfolios for the years ahead.
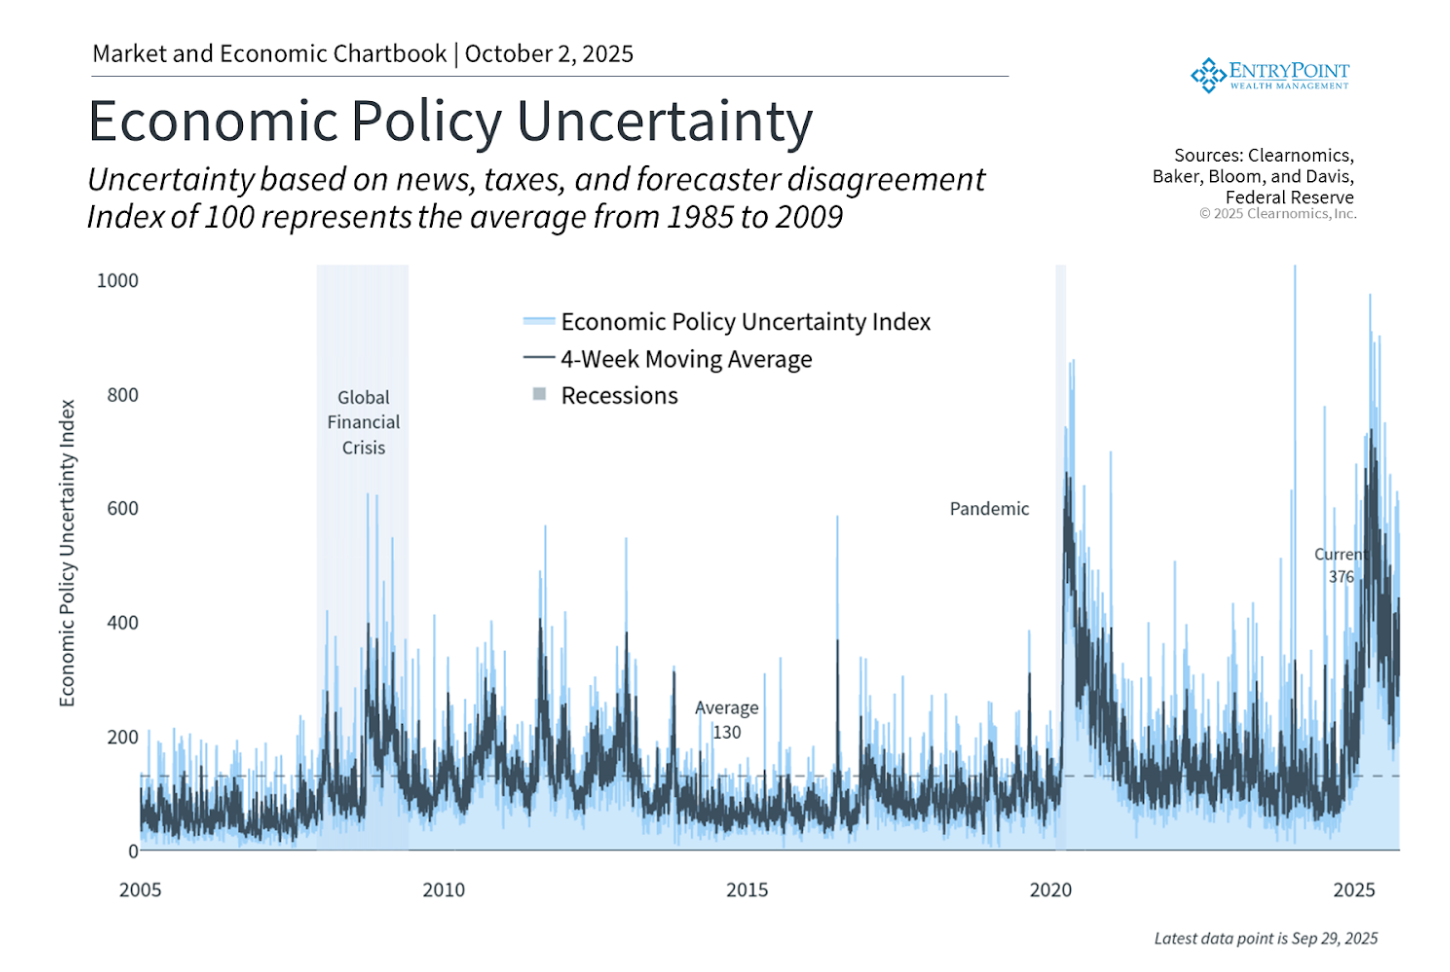
Economic Policy Uncertainty
Uncertainty based on news, taxes, and forecaster disagreement. Index of 100 represents the average from 1985 to 2009.
The bottom line? As the final quarter of the year begins, markets are near all-time highs despite mixed economic signals. This environment highlights the importance of maintaining an appropriate mix of investments and staying focused on financial goals.
With markets at record highs and signals mixed, now’s the time to ensure your portfolio is built for what’s next. Schedule a strategy session today, and together we’ll ensure that your investments stay aligned with your long-term goal.

CHRIS WARD, CFP®
Chris has been helping clients as a Financial Advisor since 2007 and established EntryPoint Wealth Management as an opportunity to offer clients access to his best partnership for financial advice. He works as an integrated partner with you and your financial life, to help you better your financial situation and achieve your goals.
CONTACT CHRIS DIRECTLY: